Introduction
Office and conference room spaces in the Metro Nashville District Energy Facility are experiencing high noise levels emanating from pumps and other mechanical equipment located nearby. David Coate Consulting (DCC) measured noise and vibration in these spaces in order to determine the severity of the problem, and to identify paths and sources of the noise and vibration. This report summarizes the results of the noise and vibration measurements and generally discusses mitigation measures. Detailed mitigation recommendations are a subject of a future phase of the project.
Structure-borne Noise
Mechanical equipment can cause high noise levels in adjacent spaces due to structure-borne noise and/or airborne noise. Structure-borne noise is caused by vibrating walls and ceiling surfaces that in turn can produce noise like a large loudspeaker. The source of such vibration can be mechanical equipment, such as pumps, which are directly coupled to the structure with no installed vibration isolation measures.
Airborne Noise
If noise levels generated by mechanical equipment are sufficiently high, airborne noise can be audible in adjacent spaces. The physics of airborne noise infiltrating an adjacent space are different and distinct from the physics of structure-borne noise. In some cases, excessive noise can be caused by some combination of airborne and structure-borne noise.
EXECUTIVE SUMMARY
Noise measurements conducted during May, 2004 indicate that noise levels in office and conference room areas are well in excess of established criteria for occupied offices. Based on the data and subsequent analysis, it is apparent that the major contribution of noise was structure borne, with primary contributions attributed to operation of the condensing water pumps. It is noted that subsequent tests are recommended during a period in the summer of 2004, at which time considerably higher plant chilled water loads are expected, and the measured noise levels are likely to increase.
1. Noise and Vibration Measurements
1.1 Equipment in Operation during Testing
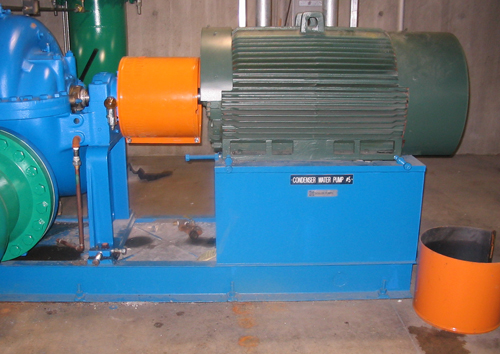
During the noise and vibration measurements, Chillers 1, 4, 6, and 9 were in operation. Chilled water pumps 3,4, and 6 were on, and condenser water pumps 4 and 5 were on. Cooling towers 1 through 7, 9 through 13, 15, and 18 were in operation. Chilled water tonnage ranged from 11,637 to 12,161, and flow rates ranged from 23,561 to 25,945 GPM. Condenser water flow rates ranged from 26,335 to 37,171 GPM.
1.2 Vibration Measurements
I measured noise and vibration in the office spaces and conference room on May 13, 2004. Only the pumps furthest away from the offices were on during the testing. Vibration measurements were conducted using a narrow-band analyzer and calibrated accelerometer. For most of these office spaces, I measured the vertical vibration of the floor since the mechanical equipment is located below. Since much of this area is carpeted and not appropriate for vibration measurements, I measured vibration on windowsills or other hard horizontal surfaces well coupled to the floor.
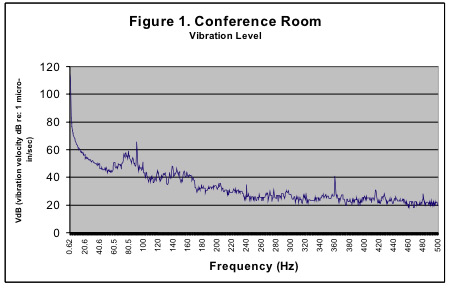
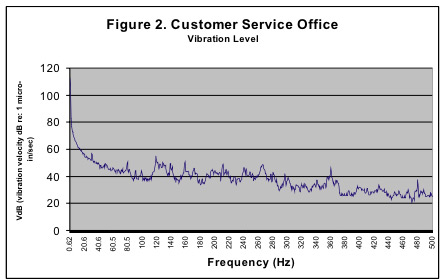
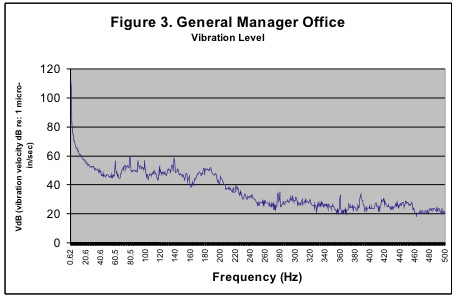
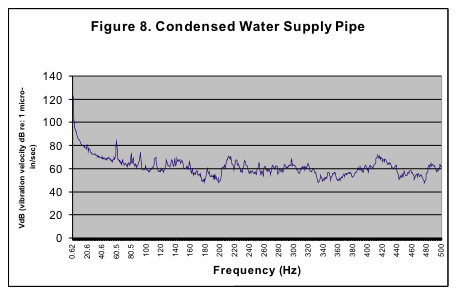
Figures 1-9 show the result of the vibration measurements. The vibration level of 65 VdB (dB re: 1 micro-in./sec) is the vibration perception threshold for most people. Figures 1-4 show vibration levels below 65 VdB in the conference room and offices and therefore annoyance due to vibration would not be an issue (according to this particular set of measurements) in these spaces.
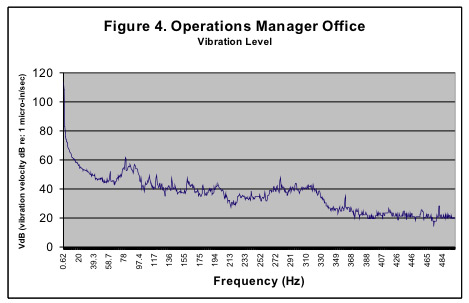
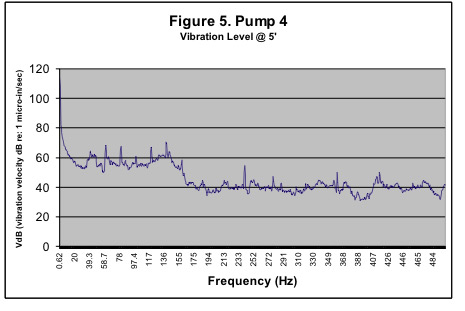
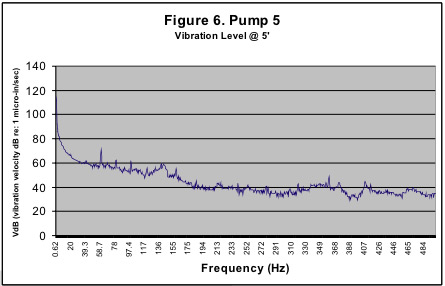
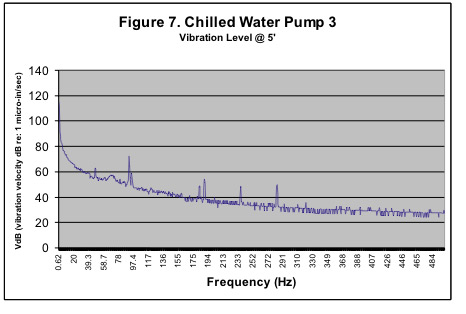
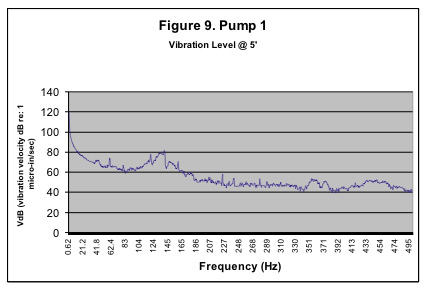
Figures 5-9 show vibration levels close to the mechanical equipment that was running during these measurements. This data is useful to identify particular peaks at specific frequencies that may also be identified in the office spaces. That is, narrow-band frequency data like these can be used as a diagnostic tool to determine exactly which pump affects which office above. While certain peaks associated with specific equipment can be traced to the offices above, no single source of vibration appears to control the vibration level in the office spaces. However, it is clear that the pumps directly below the offices and conference room are causing the audible noise in these spaces. The chillers and other equipment in the mechanical area were not producing significant noise and vibration compared with noise and vibration from the pumps.
Figure 8 shows high vibration levels (well above perception levels) associated with the condensed water supply pipe, although this data can be somewhat misleading because in this case, the accelerometer was mounted directly to the pipe. Other vibration measurements were conducted near equipment, but this was the only measurement with the accelerometer mounted directly on the equipment.
Figure 9 shows excessive vibration from pump 1 at 139 Hz. Vibration measurements close to the mechanical equipment can be helpful in diagnosing problems with bearings, etc. This particular pump was not on during most of the measurements in the offices when excessive noise levels were present so this pump was not the source of the noise and vibration. However, in general, pumps that are identical in terms of power and configuration should create about the same noise and vibration levels when running at the same speed. If one particular pump creates more vibration and noise than others do, this could mean that the pump needs maintenance. Reducing noise in the offices upstairs could also be made easier with such maintenance. However, it does not appear that lack maintenance is the overall problem with respect to excessive noise in the offices.
1.3 Noise Measurements
Concurrently with the vibration measurements, I measured noise levels in the office spaces and conference room. Noise measurements were conducted using an octave-band analyzer and calibrated precision microphone.
NC Criteria
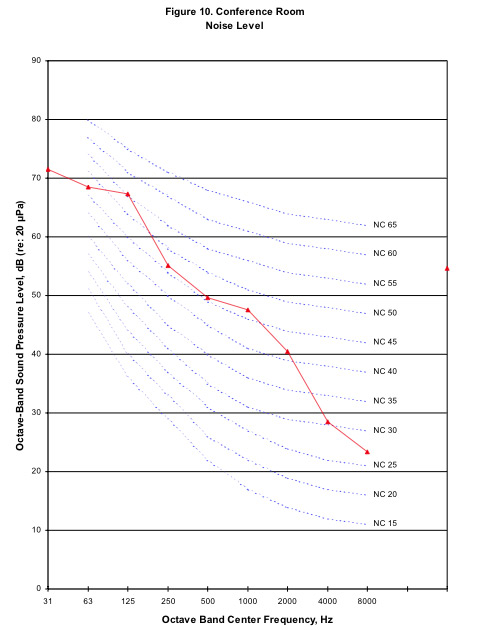
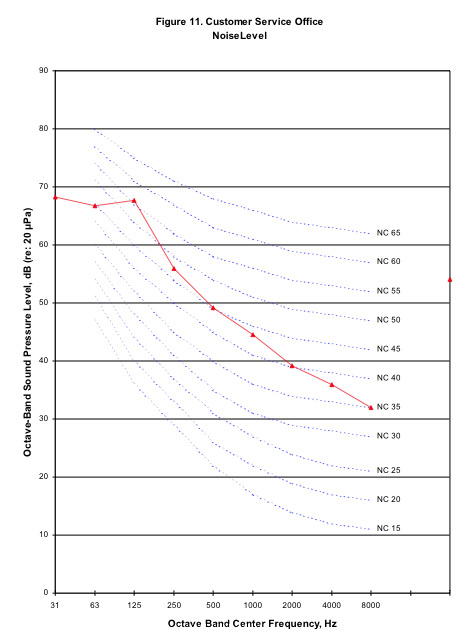
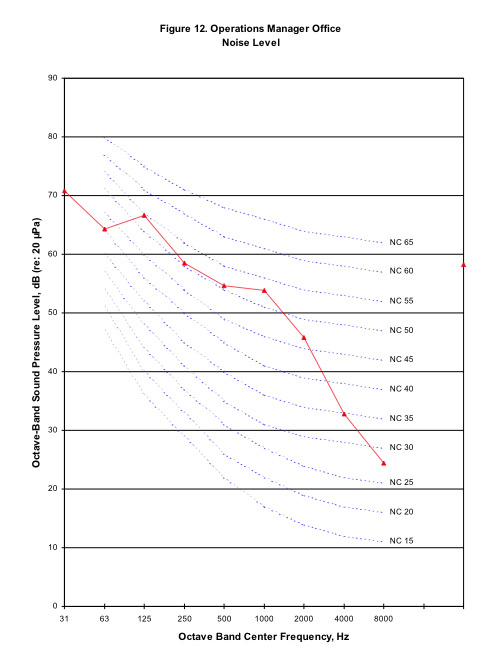
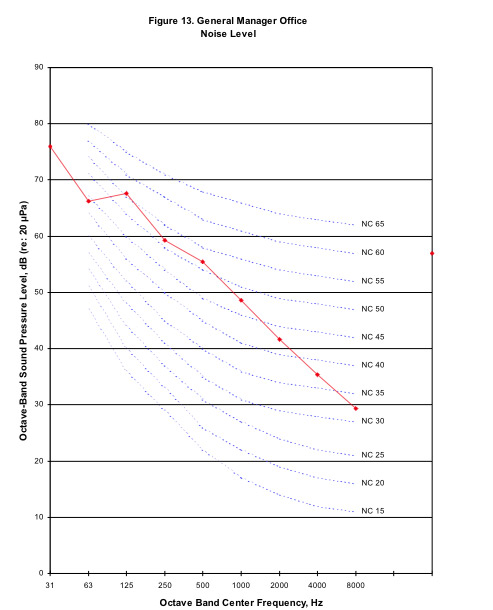
Figures 10-13 show the results of these noise measurements. All four spectra meet Noise Criteria [1] (NC) 55. Recommended noise levels for offices is NC 30-40. The measured noise levels in these offices greatly exceed these recommended NC values. In general, a 10 dB increase is perceived as a doubling of loudness�therefore, current noise levels in the office and conference room spaces would perceived well above double the loudness of acceptable criteria for these spaces.
OSHA Hearing Conservation
The Occupational Health and Safety Act of 1970 and subsequent amendments established a noise level limit (time-weighted average) of 85 dBA for 8 hours of worker exposure to noise. Figures 10-13 show noise levels ranging from 54-58 dBA, well below these OSHA hearing conservation limits. This finding is not surprising because annoyance due to noise occurs at much lower levels than for hearing damage.
2. Analysis Overview
Determination of whether the noise in the offices is caused by structure-borne and/or airborne noise mechanisms requires several steps of analysis: 1) Based on noise measurements in the mechanical equipment area below the offices, estimate noise levels in the offices due to airborne noise. This mechanism of noise transfer only involves the Transmission Loss of the floor/ceiling partition that separates the two spaces. 2) Compare estimated noise levels with measured noise levels. 3) Estimate sound pressure level (SPL) in the office and conference room spaces based on measured vibration level in these spaces. 4) Compare estimated SPL with measured SPL. 5) The extent to which either estimated airborne or structure-borne noise levels are in agreement with measured levels will determine which is the predominant mechanism of noise transfer. Another possibility is a combination of airborne and structure-borne paths.
3. Airborne Noise
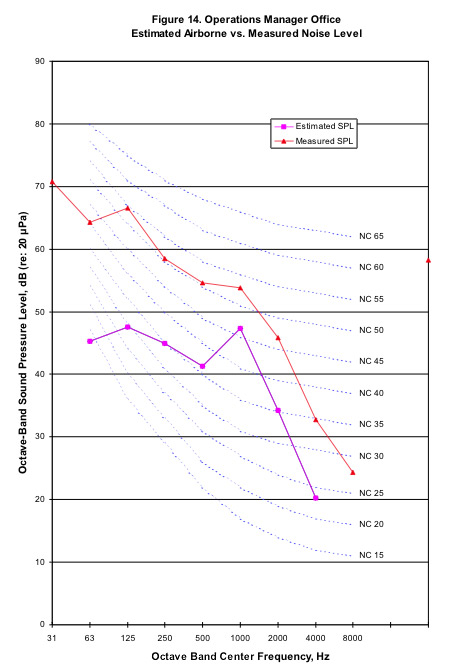
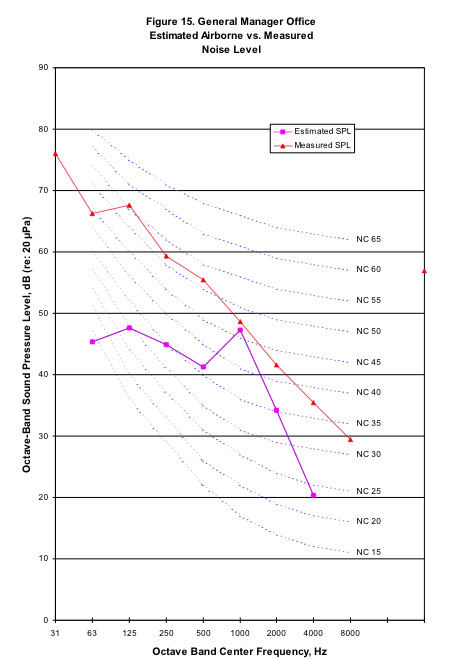
Review of the as-built drawings [2] for the facility indicate that the poured concrete floor slab that separates the mechanical room from the offices is 6" thick. Based on measured Transmission Loss (TL) of other comparable partitions, measured noise levels in the mechanical room, noise levels can be estimated for the office spaces above. During the noise measurements, only the condenser water pumps (CW pump 4 and 5) furthest from the offices were running. The only pump on directly below an office was pump CW-4, below the Operations Manager Office and near the General Manager Office. Airborne noise analyses were conducted for these two spaces.
Figures 14-15 show the results of this analysis. The frequencies of interest here are below 500 Hz since those low frequencies are controlling the overall noise level in the offices and conference room. These graphs show estimated airborne noise levels 13-20 dB lower than measured levels. This calculation indicates that if airborne noise was the main cause of the noise problem, estimated noise levels should be much higher and closer to measured values. It therefore unlikely that airborne noise is the mechanism causing the noise problem in these office spaces.
4. Structure-borne Noise
One can estimate sound pressure level in a room due to vibrating floors and walls by means of the following equation:
SPL = Vpc
Where V = vibration velocity of room surface
p = density of air
c = speed of sound
This equation assumes perfect transmission of vibration energy into acoustic sound pressure level, which is clearly not the case. However, the calculation is useful for determining whether or not structure-borne noise could be the cause of this noise problem.
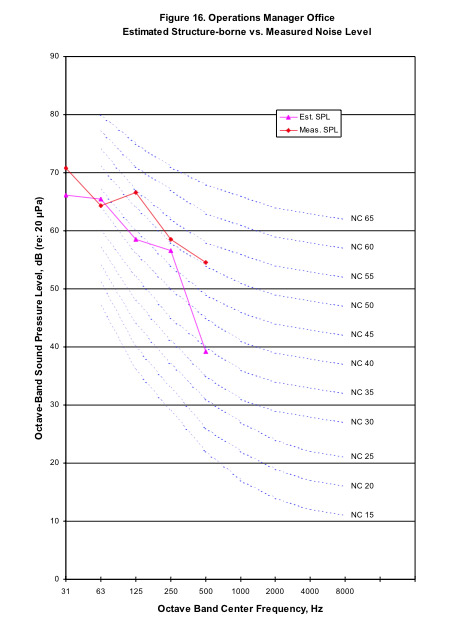
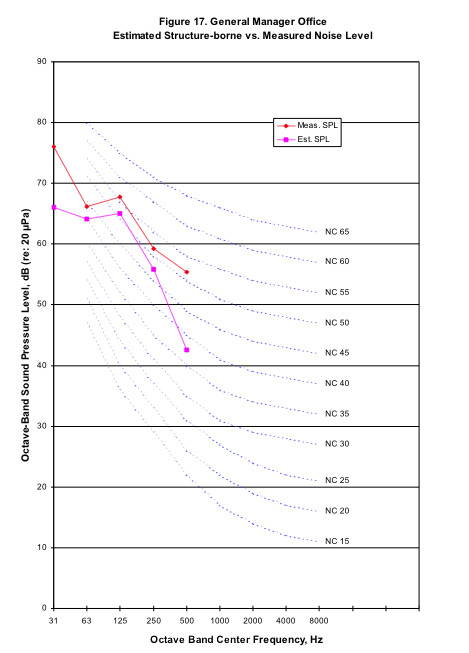
Figures 16 and 17 show estimated structure-borne noise compared with measured noise for the General Manager and Operations Manager offices. Both Figures 16 and 17 show better agreement between estimated and measured SPL compared with the airborne noise estimates. Experience indicates that perfect agreement in such an analysis would rarely occur because of the complexities of structure-borne noise mechanism and simplifying assumptions in the analysis. However, estimated and measured SPL are in relatively good agreement in the important frequencies below 500 Hz. Therefore, based on these analyses, the noise problem in the office area is likely due to structure-borne noise generated by the condenser water pumps, piping, and perhaps other equipment.
5. Additional Analyses
Condenser Water Pump 1
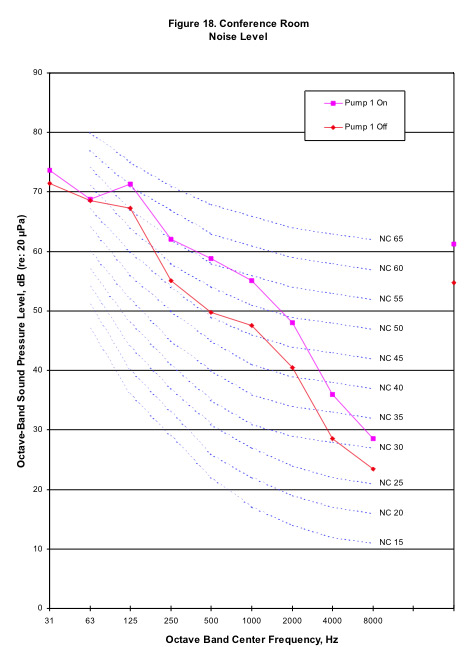
As discussed previously, during the noise and vibration measurements, the pumps directly below most of the offices were not running. In order to observe changes in noise levels due to those pumps, I asked the systems operator to turn pump 1 on. During this test, operations data indicates that CW pumps 4 and 5 continued to run. Figure 18 shows noise levels in the conference room with CW pump 1 on compared with CW pump 1 off (and the other pumps located further away during normal operations running). Turning CW pump 1 on resulted in increased noise of 3 to 10 dB at certain frequencies. The resulting NC value for this condition is NC 60, which greatly exceeds the recommended NC 30-40 for office spaces. Close in vibration measurements of this pump indicates excessive vibration levels at 125 Hz octave band (139 Hz peak narrow band) which correspond with the peak in the noise spectrum at 125 Hz. This test indicates that noise levels in each office space are dependent upon the proximity of the pump to the space. Therefore, noise levels would be even higher in the office spaces if the pumps directly below were running.
City Water Make-up Valve Test
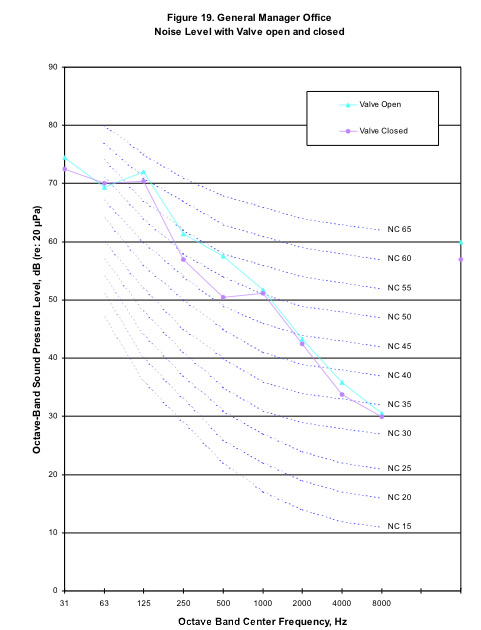
Opening the city water make-up valve located in close proximity to the General Manager office results in a clearly audible increase in noise. Figure 19 compares the valve open and closed noise levels. While the overall A-weighted noise level only increased by 3 dBA, noise levels in the midfrequencies increased by as much as 7 dB. This test indicates that piping directly coupled to the structure is at least part of the structure-borne noise problem.
6. CONCLUSIONS AND RECOMMENDATIONS
In conclusion, noise levels in the conference room and offices are at NC 55 and greatly exceed recommended NC 30-40 for office spaces. Noise levels would be even higher when pumps directly below them are operating. For example, when CW pump 1 was on, noise levels in the conference room are at NC 60. Vibration levels in the offices and conference room were generally below perception levels, but the pumps directly below many of these offices were not running at the time of the measurements. However, when CW pump 1 was on, the vibration level in the conference room at 80 Hz was 71 VdB, well above perception level.
This initial analysis of structure-borne and airborne paths indicates that structure-borne noise is the main cause of the noise in the offices and conference room. This type of structure-borne noise problem is caused by insufficient vibration isolation of mechanical equipment and/or associated piping. Further diagnostic tests will be needed to ascertain exactly which equipment needs vibration isolation. Because of the complexity of the noise environment, some additional testing to confirm the predominance of the structure-borne noise path is also warranted.
Mitigation measures in this case could consist of some combination of the following:
- Vibration isolation of pumps. The pumps can impart vibration directly into the floor, which can then excite the building structure. Vibration isolation pads, sometimes consisting of springs with certain static and dynamic deflection characteristics can reduce vibration. Vibration measurements up close to these pumps indicate moderately high vibration levels, which may not be sufficiently coupled to the second floor to produce the high noise levels in the offices.
- Vibration isolation of piping. The piping connected to the pumps may be rigidly connected to the structure and in close proximity to the offices. Neoprene or some other less rigid connection may required to reduce such vibration.
- Floating floors/partitions. It is possible to install floating floors and/or decoupled walls and ceilings in the office and conference room spaces to reduce vibration and noise. A floating floor consists of neoprene pads supporting a several inch thick concrete slab. This type of approach can reduce vibration and noise, but there are practical limitations such as increased floor elevation. A decoupled-ceiling in the mechanical room may be possible as well, but limitations due to pipe penetrations may render that option impractical.
[1] NC Criteria were originally developed by Dr. Leo Beranek in 1954. Standards that reference these criteria include ASHRAE 130-1996, ANSI S12.60-2002, and ARI 885-98 2002.
[2] Dated September 20, 2002