The Paris Street Community Center, located in East Boston, Massachusetts was completely renovated. As part of the renovation, several rooftop HVAC units were planned. This report details the expected noise effects associated with the rooftop units for comparison with the City of Boston noise level limits. The report also provides noise attenuation recommendations.
Ambient Noise Measurements
City of Boston residential noise limits are 50 dBA during the night and 60 dBA during the day. However, ambient noise levels in the vicinity of the facility are high by virtue of the fact that Logan Airport is nearby as well as the toll booth area for the tunnel/expressway. In order to determine whether or not ambient noise levels already exceed the Boston noise limits, ambient noise measurements were conducted by a DCC sound engineer for 19 hours on the roof of the facility. The particular location of the microphone was within a few feet of the nearest residential building (110 Paris Street). Ambient noise measurements were conducted using a Type I sound analyzer (Norsonics 118) with calibration traceable to National Institute of Standards and Technology (NIST).
Figure 1 shows the results of the ambient noise measurements with hourly Leq values in blue and the L90 in red. The Leq is essentially the average noise level during a given hour, whereas the L90 (the level exceeded 90% of each hour) is often used to represent the lowest ambient noise level since it “filters out” short transient noise events.
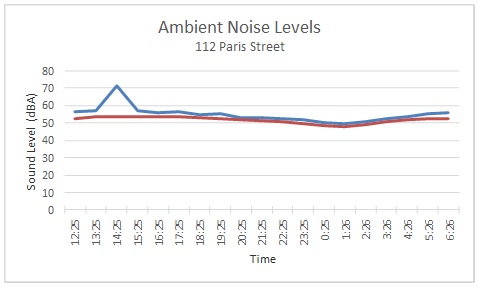
The data in Figure 1 indicates that Leq values never went below 50 dBA, and the L90 went slightly below 50 dBA between 1 and 2 am. Since RTUs would not be operating in the middle of the night, this ambient noise data shows that attenuating rooftop unit noise levels below 50 dBA may not be warranted. In other words, since ambient noise levels are already higher than 50 dBA, noise attenuation of RTUs to below 50 dBA may not be discernable.
CADNA Noise Modeling
Since the edge of the roof of the facility will act as a noise barrier with respect to the RTUs and residential buildings at a lower elevation, the RTU noise analysis was performed using 3D noise modeling techniques. CADNA, an international accepted noise modeling software package, was used to model this site. Building plan and elevation data as well as octave band sound power data for each RTU and RTU locations were modeled in CADNA. Table 1 shows the octave band sound power data used in the CADNA analysis.
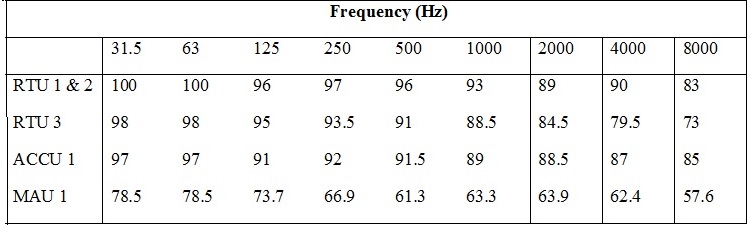
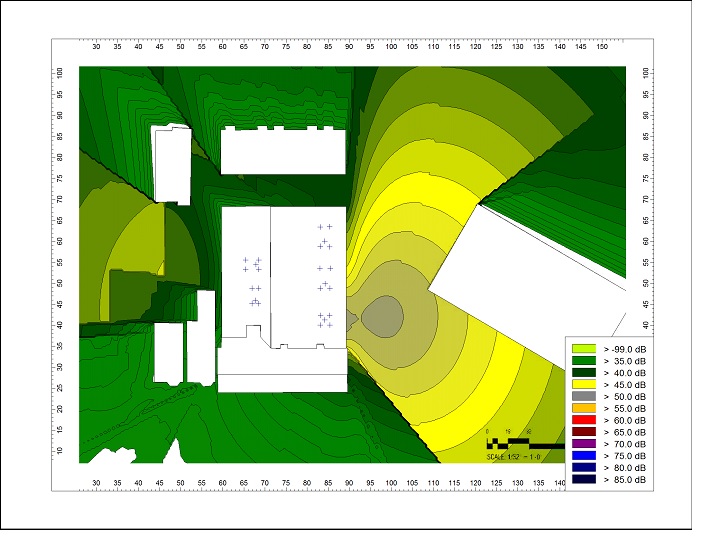
Figure 2 shows the results of the RTU noise modeling at an elevation of 7.5 meters, the approximate elevation of third story adjacent residential windows.
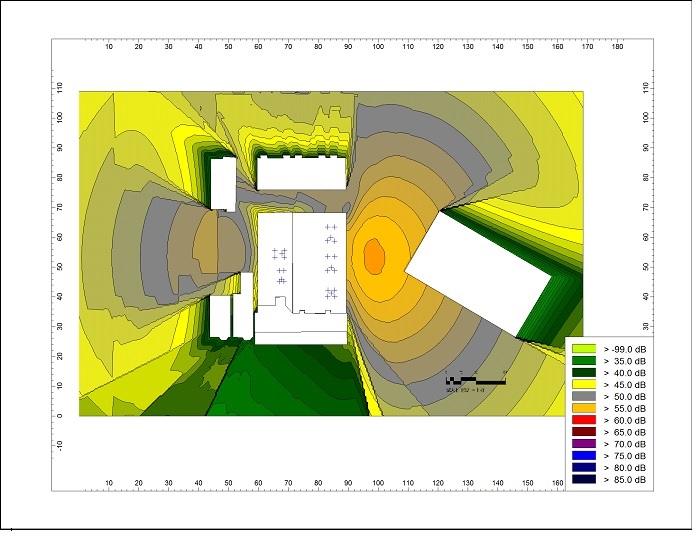
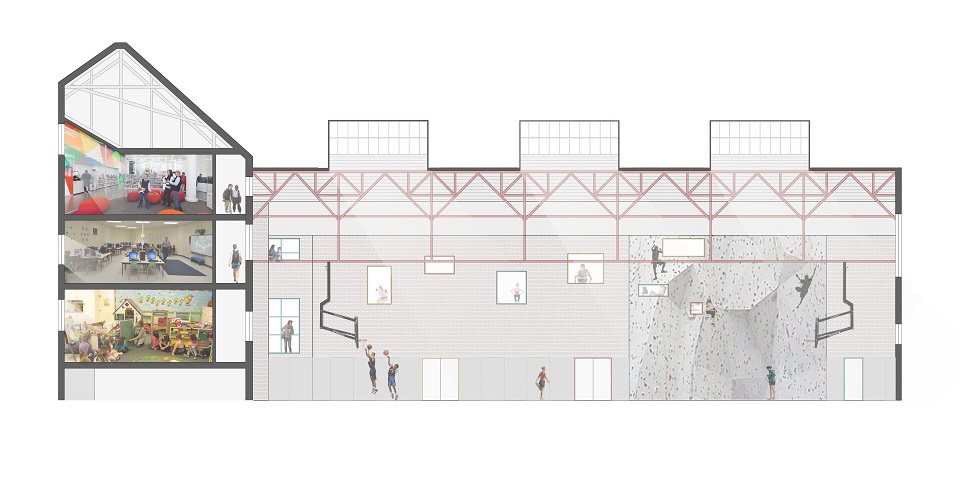
The data in Figure 2 shows that the noise levels at 110 Paris Street would be at 47 dBA, below the 50 dBA nighttime limit. However the noise level at 135 Havre Street would be at 52 dBA, slightly above the nighttime limit. Figure 3 shows a cross section view of the noise contours between the facility and the rear of 135 Havre Street. The gray contour is at 50 dBA and moving down, the noise levels decrease to 45 dBA at ground level. In other words, because of the diffraction of sound that would occur at the roof edge, only a small portion at the top of the 135 Havre street building would be slightly above 50 dBA.
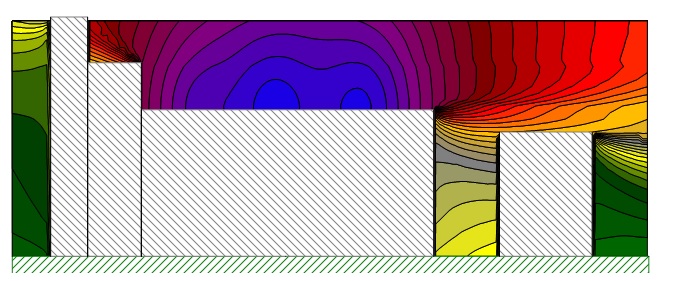
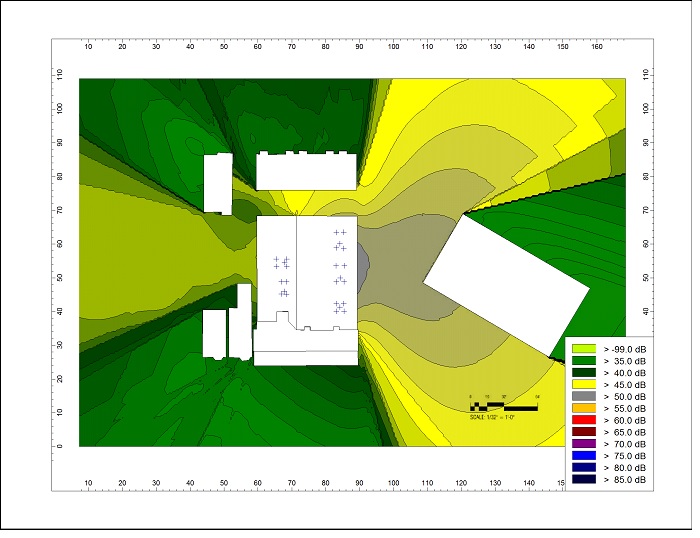
Figure 4 shows noise contours at ground level. This data more dramatically shows the noise barrier effects of the roof edge. Noise levels at ground level would range from 42 dBA to 46 dBA. Only the small gray area immediately to the right of the facility would be at 50 dBA.
Noise Attenuation
Even though predicted RTU noise levels are only slightly above the nighttime noise limit at certain locations and ambient noise levels are relatively high, DCC performed an additional analysis assuming that silencers would be installed on RTU 1, 2, and 3. Using the dynamic insertion loss data from Attachment (Silencer Schedule), Figure 5 shows noise contours at 7.5 meters elevation. The green noise contours are at 40 dBA and lower, which is substantially below the nighttime noise level limit of 50 dBA. For this modeling scenario, noise levels would be below 50 dBA around the entire perimeter of the facility.