 1. Summary of Results
David Coate Consulting (DCC) conducted this traffic noise study to determine the potential noise impacts associated with proposed improvements to Interstate 195 Taunton Ave./Warren Ave. Interchange in East Providence, Rhode Island. A total of four alternatives, Future No-Build, Veterans Memorial Parkway Alternative, Waterfront Drive 1 Alternative, and Waterfront Drive 2 Alternative were studied. The noise study was conducted in accordance with Federal Highway Administration (FHWA) and Rhode Island Department of Transportation (RIDOT) traffic noise analysis procedures.
The results of this study show that traffic noise levels in the study area are already at or above FHWA noise standards. Future No-Build and Build noise levels will increase slightly as a result of increased traffic volumes. Since future noise levels will be above federal noise standards, noise mitigation should be considered, where feasible and reasonable. Several noise barrier configurations were studied, and two different barriers appear to be reasonable and feasible according to RIDOT noise policy standards. [1]
2. Introduction
The purpose of this report is to identify the noise impacts and potential noise mitigation measures associated with the proposed ramp modifications of the Interstate 195 Taunton Ave./Warren Ave. Interchange in East Providence, Rhode Island due to changes in traffic volumes, speeds, reconfiguration of ramps, and retaining walls associated with the build alternatives. The goal of this study is to define the existing noise environment of the study area, determine the change to the noise environment associated with proposed alternatives, determine the impact of the resulting changes to noise sensitive receptors as defined by applicable standards and criteria, and where such impacts exist, determine the feasibility and reasonableness of mitigation measures.
3. Project Description
The purpose of the project for Improvements to the I-195/Taunton Avenue/Warren Avenue Interchange is to:
- improve ramp access to and from Interstate 195 at the existing interchange;
- reduce congestion and improve traffic operations within the vicinity of the interchange;
- reduce accident levels within the immediate vicinity of the interchange;
- improve the transportation infrastructure and functionality within the project limits, while, at the same time, benefiting the local community through design solutions that are sensitive to the area;
- adequately prepare for currently projected growth and related transportation needs within the effective design life of the facility.
A total of four alternatives, Future No-Build, Veterans Memorial Parkway Alternative, Waterfront 1 Alternative, and Waterfront 2 Alternatives were studied.
4. Noise Metrics and Abatement Criteria
4.1 Noise Metrics
The basic noise unit employed in this study is the A-weighted decibel (dBA). The decibel is a logarithmic scale used to measure the relative loudness of sounds. Figure 4.1 illustrates sound pressure levels in dBA of various sound sources between 0 dBA (threshold of hearing) and 140 dBA (threshold of pain).
An increase of 3 dBA in noise level can barely be perceived[2], while an increase of 5 dBA is readily noticeable and considered a substantial noise increase [3]. A 10 dBA increase corresponds to a subjective doubling of loudness. A relationship between changes in noise level and loudness is indicated in Table 4.1.
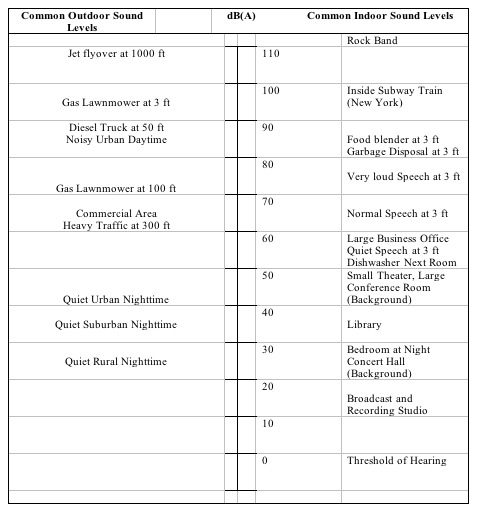
Figure 4.1. Sound Pressure Levels for Various Sound Sources
Since noise fluctuates from moment to moment, it is common practice to condense the noise level over a specified period of time into a single number called the Equivalent Noise Level (Leq). Many surveys have shown that the Leq properly predicts annoyance, and thus this metric is commonly used for noise measurements, prediction, and impact assessment.
The reader is referred to Appendix A for further discussion about noise descriptors and metrics.
4.2 Noise Impacts and Abatement Criteria
The noise impacts for this project were evaluated in accordance with applicable FHWA and RIDOT guidelines and criteria. [4]
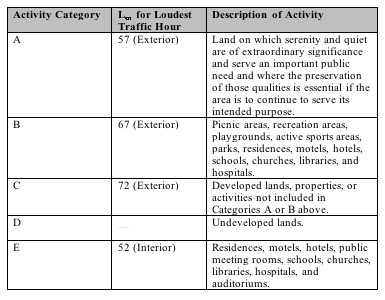
The FHWA Noise Abatement Criteria shown in Table 4.2 were used in determining traffic noise impacts on human activities. Noise impacts are defined by loudest hour equivalent noise levels (Leq) approaching or exceeding these Noise Abatement Criteria values for the appropriate Activity Category. For example, the Noise Abatement Criterion for residential areas (Category B) is 67 dBA Leq. However, in 1993 the FHWA announced that "...all state highway agencies must establish a definition of 'approach' that is at least 1 dBA less than the FHWA Noise Abatement Criteria for use in identifying traffic noise impacts in traffic noise analyses."[5] Therefore, 66 dBA effectively becomes the Noise Abatement Criteria for the residential land use category, and is incorporated throughout this analysis.
In addition to the absolute NAC values, noise abatement will also be considered if the project will substantially increase the noise level at sensitive receptor locations. According to RIDOT's Noise Policy[1], a substantial increase is defined as an increase of 15 dBA or greater.
When noise impacts are found to exist, an investigation is made into potential measures for reducing the noise impact. If it is found that such mitigation measures are not feasible for economic, social, or environmental reasons, they may be dismissed from further consideration.
Table 4.1 Relationship Between Changes in Noise Level and Loudness
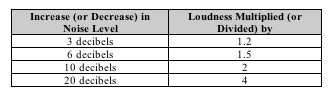
Table 4.2 FHWA Noise Abatement Criteria
5. Existing Noise Environment
5.1 Noise Measurements/Traffic Model Validation
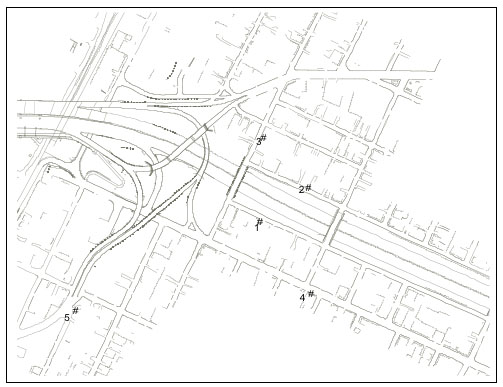
Noise measurement locations were selected within the project area to be representative of noise sensitive receptors in areas where traffic volumes would change as a result of project improvements. Figure 5.1 shows the location of these noise measurement locations.
Figure 5.1 Noise Measurement Locations
Traffic noise validation modeling is typically done as an initial step in traffic noise modeling to insure that predictions of future traffic noise are reasonably accurate. Essentially, modeled results of existing traffic conditions are compared with measured noise levels at each noise measurement location. Generally, if modeled versus measured values are within +or- 3 dBA of each other, no additional modifications to the traffic noise model are necessary. If such a condition is met, validation modeling components are then applied to the No-Build model and to Future Build models, where appropriate.
On June 16, 2005, DCC and Gordon Archibald Engineers (GRA) staff measured traffic noise and counted traffic volumes concurrently with the measurements. Based on traffic counts, vehicle classifications, vehicle speeds, and roadway geometry, DCC used FHWA's Traffic Noise Model (TNM) to compute hourly average (Leq) noise levels.
Table 5.1 shows the results of this analysis.
Table 5.1 Comparison of Predicted vs. Measured Hourly Leq Values
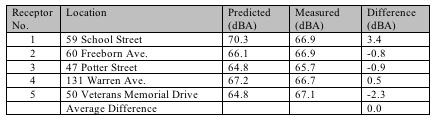
As can be seen from Table 5.1, measured and predicted noise levels agree within +or- 3 dBA for all measurement locations. The average difference between predicted and measured results for all measurement locations was 0 dBA.
These results indicate that the validation modeling techniques, using TNM, can be applied to the No-Build case, and to Future Build cases where appropriate.
5.2 Loudest Hour
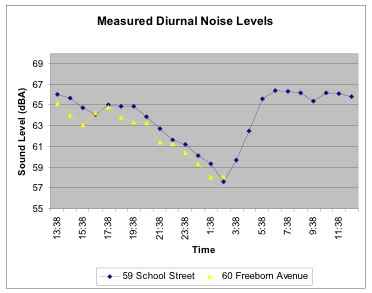
Figure 5.2 shows traffic noise levels measured from June 16 - 17 using automated noise monitors located at 59 School Street and 60 Freeborn Avenue. The purpose of these unattended measurements was to determine the loudest hour for existing conditions. The loudest hour was 5:30 am to 6:30 am with a measured noise level of 66 dBA. A full 24 hour noise measurement was recorded at 59 School Street, and 14 hours of data were recorded at 60 Freeborn Avenue due to battery failure. It is obvious from Figure 5.2 that noise levels at both monitors, due to mainline traffic, were essentially consistent with each other and therefore the 60 Freeborn data can be extrapolated to follow the data from the 59 School Street monitor.
Figure 5.2 Measured Diurnal Noise Levels
6. Future Noise Environment and Impacts
6.1 Traffic Noise
Since the loudest measured hour corresponds to the morning commute, peak am traffic volumes for future roadway alternatives were used for the traffic noise modeling. FHWA's TNM program was used to predict noise levels at each sensitive receptor location discussed in Section 5. The input to the model included: the alignment of the roadways and the locations of receptors (homes, schools, etc.) in three dimensional Cartesian coordinates; hourly traffic volumes and speeds for autos, medium and heavy trucks for each modeled roadway; retaining walls, topography, and proposed noise barriers.
Traffic data for each modeled roadway for the No Build and Build Alternatives (design year 2030) were supplied by GRA and were incorporated into TNM. The Build Alternatives include:
- Veterans Memorial Parkway Alternative
- Waterfront 1 Alternative
- Waterfront 2 Alternative
A summary of predicted existing (2005) and design year (2030) noise levels for each measurement location for each alternative are presented in Table 6.1.
Table 6.1 Loudest Hour Traffic Noise Summary/Alternative Comparison (Leq, dBA)*
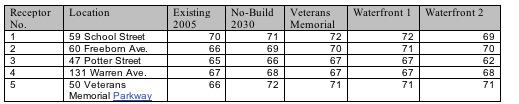
*without mitigation
As can be seen from Table 6.1, predicted noise levels for existing conditions, and all alternatives are greater than or equal to FHWA's residential Noise Abatement Criterion of 66 dBA, except at Receptor 3 for certain alternatives. This particular location is a substantial distance away from the Interstate 195 mainline, and as a result experiences lower traffic noise levels.
All future alternatives are noisier than existing conditions simply because of the increased traffic volumes. The noise levels associated with the No-Build and Build Alternatives vary only slightly from each other due to small to moderate variations in traffic volumes, speeds, and roadway geometry. With the exception of Waterfront 2 for Receptor 3, these future alternatives vary less than 3 dBA from each other, which would be an imperceptible difference. However, there would be a perceptible (i.e., greater than 3 dBA) increase in noise level between existing and future conditions at Receptor 5 (50 Veterans Memorial Parkway).
Relative Noise Impacts
There are no receptors where the increase between existing and future conditions would be 15 dBA or greater, so there would be no noise impacts according to RIDOT's relative impact criterion.
Absolute Noise Impacts
According to FHWA policy, noise mitigation measures should be considered, where reasonable and feasible, for build alternatives where predicted noise levels would meet or exceed 66 dBA. This threshold value is met or exceeded for all build alternatives.
6.2 Construction Noise
Construction activities will increase short-term sound levels as a result of the use of heavy machinery. These increases may create a temporary adverse impact to nearby receptor locations.
Major sources of construction noise typically include pile drivers, jackhammers, trucks, cranes, excavating equipment, and miscellaneous support equipment. Potential mitigation techniques for construction noise include limiting construction activity to daytime hours, ensuring that all diesel powered equipment has effective mufflers, and erecting temporary noise barriers between construction operations and sensitive receptor locations. Use of alternative construction methods (e.g., using vibratory instead of impact pile drivers) could also reduce construction noise. Since detailed construction equipment and scenarios are not available at this phase of the project, specific mitigation measures have not been developed.
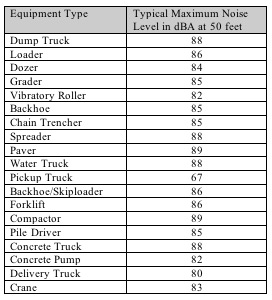
Typical construction noise levels associated with common highway construction equipment are shown in Table 6.2.
Table 6.2 Typical Construction Noise Levels
7. Mitigation Measures
A number of noise abatement measures have been considered for each build alternative, including traffic management, alterations of alignment, acquisitions of buffer zones, sound insulation of non/profit institutional buildings, and noise barriers.
Traffic Management: Traffic management measures are sometimes feasible for noise abatement. Prohibition of truck traffic, especially heavy-truck traffic, would produce significant noise benefits. However, such prohibition is not possible for this project, which currently carries substantial truck traffic, and that is not expected to change in the future. Time-use restrictions on truck traffic would not be possible in the long term.
Lower speed limits would produce lower noise levels, but speed restrictions would contradict the purpose of this project which is to enhance traffic flow. Consequently, traffic management is not a feasible long-term noise abatement measure for this project.
Alteration of alignment: For a proposed new roadway, it is sometimes possible to alter the horizontal alignment, to move it further from noise-sensitive receptors. Changes in alignment must at least triple the distance between roadway and receptor in order to produce significant benefits. Because of the densely populated nature of this area, substantial changes in horizontal alignment are not possible.
Acquisition of buffer zones: Where unimproved property exists between noise-sensitive receptors and a roadway corridor, acquisition of this property can preempt future development close to the roadway. However, no such opportunities exist along this proposed alignment.
Sound Insulation of Non-profit Institutional Buildings: There are no impacted non-profit institutional buildings in the study area.
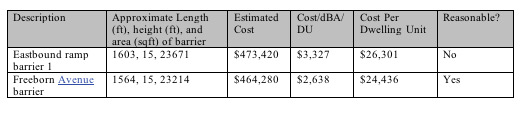
Noise Barriers: Noise barriers have been evaluated for build alternatives that approach or exceed the FHWA Noise Abatement Criteria. Tables 7.1 through 7.3 show the results of noise barrier analyses, using TNM, which includes the number of receptors that would experience at least 5 dBA noise reduction, barrier dimensions, estimated total barrier cost, and cost per dwelling unit.
RIDOT noise policy[1] indicates that noise barriers are considered feasible if the noise reduction is 5 dBA or greater and reasonable if the cost/dBA/dwelling unit protected is $2,500 or less or if the cost/dwelling unit protected is $25,000 or less. For the Veteran's Memorial Parkway Alternative, the Westbound Ramp Barrier 2 meets this criterion and would be considered reasonable and feasible. For the Waterfront 1 and 2 Alternatives, the Freeborn Avenue barrier would be considered reasonable and feasible. The locations of these noise barriers are shown in Figures 7.1 and 7.2.
Table 7.1. Noise Barrier Cost Per Dwelling Unit- Veterans Memorial Alternative
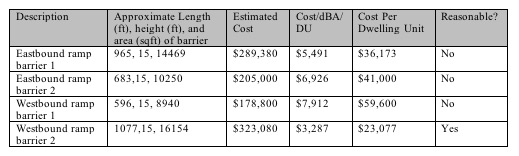
Table 7.2 Noise Barrier Cost Per Dwelling Unit- Waterfront 1 Alternative
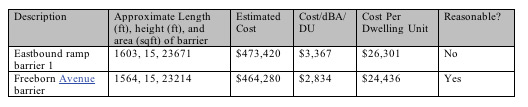
Table 7.3 Noise Barrier Cost Per Dwelling Unit- Waterfront 2 Alternative
Appendix A: Noise Descriptors and The Effects of Noise
Noise Descriptors
Noise is usually defined as sound that is undesirable because it interferes with speech communication and hearing, is intense enough to damage hearing, or is otherwise annoying. The characteristics of sound include parameters such as amplitude, frequency, and duration.
Sound can vary over an extremely large range of amplitudes. The decibel (dB) is the accepted standard unit for measuring the amplitude of sound because it accounts for these large variations in amplitude and reflects the way people perceive changes in sound amplitude. The decibel is based on a logarithmic scale which compresses the very large range of possible air pressure values into a more manageable scale.
Different sounds may have different frequency content. Frequency content of a sound refers to its tonal quality or pitch. When describing sound and its effect on a human population, A-weighted (dBA) sound levels are typically used to account for the response of the human ear. The term "A-weighted" refers to a filtering of the noise signal to emphasize frequencies in the middle of the audible spectrum and to de-emphasize low and high frequencies in a manner corresponding to the way the human ear perceives sound. This filtering network has been established by the American National Standards Institute (ANSI). The A-weighted noise level has been found to correlate well with peoples judgements of the noisiness of different sounds and has been used for many years as a measure of community noise.
Community noise levels usually change continuously during the day. However, community noise typically exhibits a daily, weekly, and yearly pattern. To compare noise levels over different time periods, several descriptors have been developed. One descriptor, the equivalent sound level (Leq), is the equivalent steady-state A-weighted sound level that would contain the same acoustical energy as the time-varying A-weighted sound level during the same time interval. The hourly Leq is often used to describe traffic noise.
Another descriptor for noise is the statistical A-weighted noise level exceeded a given percentage of the time. For example, the L50 is the level exceeded 50 percent of the time and the L10 is the level exceeded 10 percent of the time.
The day-night average noise level (DNL or Ldn), was developed to evaluate the total daily community noise environment. The DNL is the time average of all A-weighted levels for a 24-hour period with a 10 dB upward adjustment added to the nighttime levels (2200 to 0700). This adjustment is an effort to account for the increased sensitivity to nighttime noise events. The DNL noise metric has been adopted by federal agencies including the Environmental Protection Agency (EPA), the Federal Aviation Administration (FAA), and the Housing and Urban Development (HUD) as the accepted unit for quantifying human annoyance to environmental noise.
Effects of Noise
When high noise levels are experienced inside or outside people's homes, as may occur from the passage of motor vehicles or the operation of mechanical equipment, a feeling of annoyance may result. These noise levels may also interfere with the performance of various activities such as conversation, TV watching, sleeping, etc. The degree to which there is annoyance and/or activity interference depends on the magnitude of the intruding noise level, the frequency with which it occurs and the time of day of occurrence. In response to the Noise Control Act of 1977, which directed the EPA to establish a recommended measure to describe community noise, the day-night average sound level (DNL) was selected as the unit of measurement to be used to predict annoyance from noise exposure.
Several social surveys have been conducted in which peopleŐs reaction to their noise environment has been determined as a function of the DNL occurring outside their homes. Guidelines have been developed for individual land uses based upon the information collected in these surveys and upon information concerning activity interference. For various land uses, the level of acceptability of the noise environment is dependent upon the activity that is conducted and the type of building construction (for indoor activities). The American National Standards Institute has provided land-use compatibility guidelines for a variety of land uses based on DNL6. The EPA has recommended DNL 55 as adequate to protect the public health and welfare with an adequate margin of safety7. Except for special function land uses, all land uses are compatible with DNL 55 and below. (Note that DNL 55 would result in approximately 5 percent of the population being highly annoyed. It should be recognized that in any noise environment some people would always indicate annoyance and some people would never indicate annoyance regardless of the noise level.)
REFERENCES
- Noise Abatement Policy Rhode Island, State of Rhode Island and Providence Plantations Department of Transportation, September 6, 2000
- Fundamentals and Abatement of Highway Traffic Noise, Bolt Beranek and Newman, 1973.
- Assessment of Noise with Respect to Community Response, ISO R1996, International Organization for Standardization, Switzerland
- Procedures for Abatement of Highway Noise and Construction Noise Federal Highway Administration 23 CFR Part 772, Final Rule, effective 9 August 1992
- Office of Environment and Planning, Memorandum HEP-41 December 1993
- Sound Level Descriptor for Determination of Compatible Land Use. ANSI S12.40-1990, American National Standards Institute, 1990
- Information of Levels of Environmental Noise Requisite to Protect Public Health and Welfare with an Adequate Margin of Safety, EPA/ONAC 550/9-74-004, EPA, Washington, D.C., March 1974